Fishbone Diagram in GMP Investigations
A Fishbone diagram is a practical root cause analysis tool for GMP investigations when the event may have more than one possible cause pathway.
It is also called an Ishikawa diagram or cause-and-effect diagram. Many teams also know it as the 6M method because traditional Fishbone categories are often built around Man, Machine, Method, Material, Measurement, and Mother Nature.
In GMP investigations, the value of a Fishbone diagram is not the diagram itself. The value is that it helps the team think broadly before narrowing to the supported cause.
As discussed in Pharmaceutical Investigations & CAPA, an investigation should move from event facts to supported conclusions. A Fishbone diagram can help organize possible causes, but each branch still needs evidence.
What a Fishbone Diagram Is
A Fishbone diagram starts with the problem statement at the “head” of the fish. The main “bones” are cause categories. Under each category, the investigation team lists possible causes or contributing factors.
For example, if the event is a missing batch record entry, possible branches may include:
People/Human Performance
Procedure/Method
Equipment/System
Record Design
Workflow
Controls/Verification
The diagram helps the team avoid jumping too quickly to one explanation, especially human error. It creates a structured way to ask, “What else could reasonably have contributed?”
But the Fishbone does not prove the root cause.
A Fishbone diagram is a thinking tool, not a conclusion.
How the 6Ms Translate into GMP Categories
The traditional 6Ms are useful, but the wording can feel dated or too manufacturing-focused. In GMP investigations, it is often clearer to translate the categories into practical investigation language.
| Traditional 6M | GMP-Friendly Category | What It May Include |
|---|---|---|
| Man | People / Human Performance | Operators, analysts, reviewers, training, competency, task execution, supervision, workload, interruptions |
| Machine | Equipment / Instrument / System | Manufacturing equipment, lab instruments, computerized systems, alarms, interfaces, utilities, maintenance status |
| Method | Procedure / Process / Method | SOPs, batch records, test methods, work instructions, process sequence, cleaning method, sampling method |
| Material | Material / Component / Sample | Raw materials, components, labels, samples, standards, reagents, media, packaging materials |
| Measurement | Testing / Inspection / Data | QC testing, calculations, monitoring, sampling, inspection, data review, audit trails, acceptance criteria |
| Mother Nature | Environment / Facility / Conditions | Room conditions, HVAC, pressure cascade, temperature, humidity, contamination risk, personnel/material flow |
These categories are starting prompts. They are not mandatory boxes that must receive equal effort in every investigation.
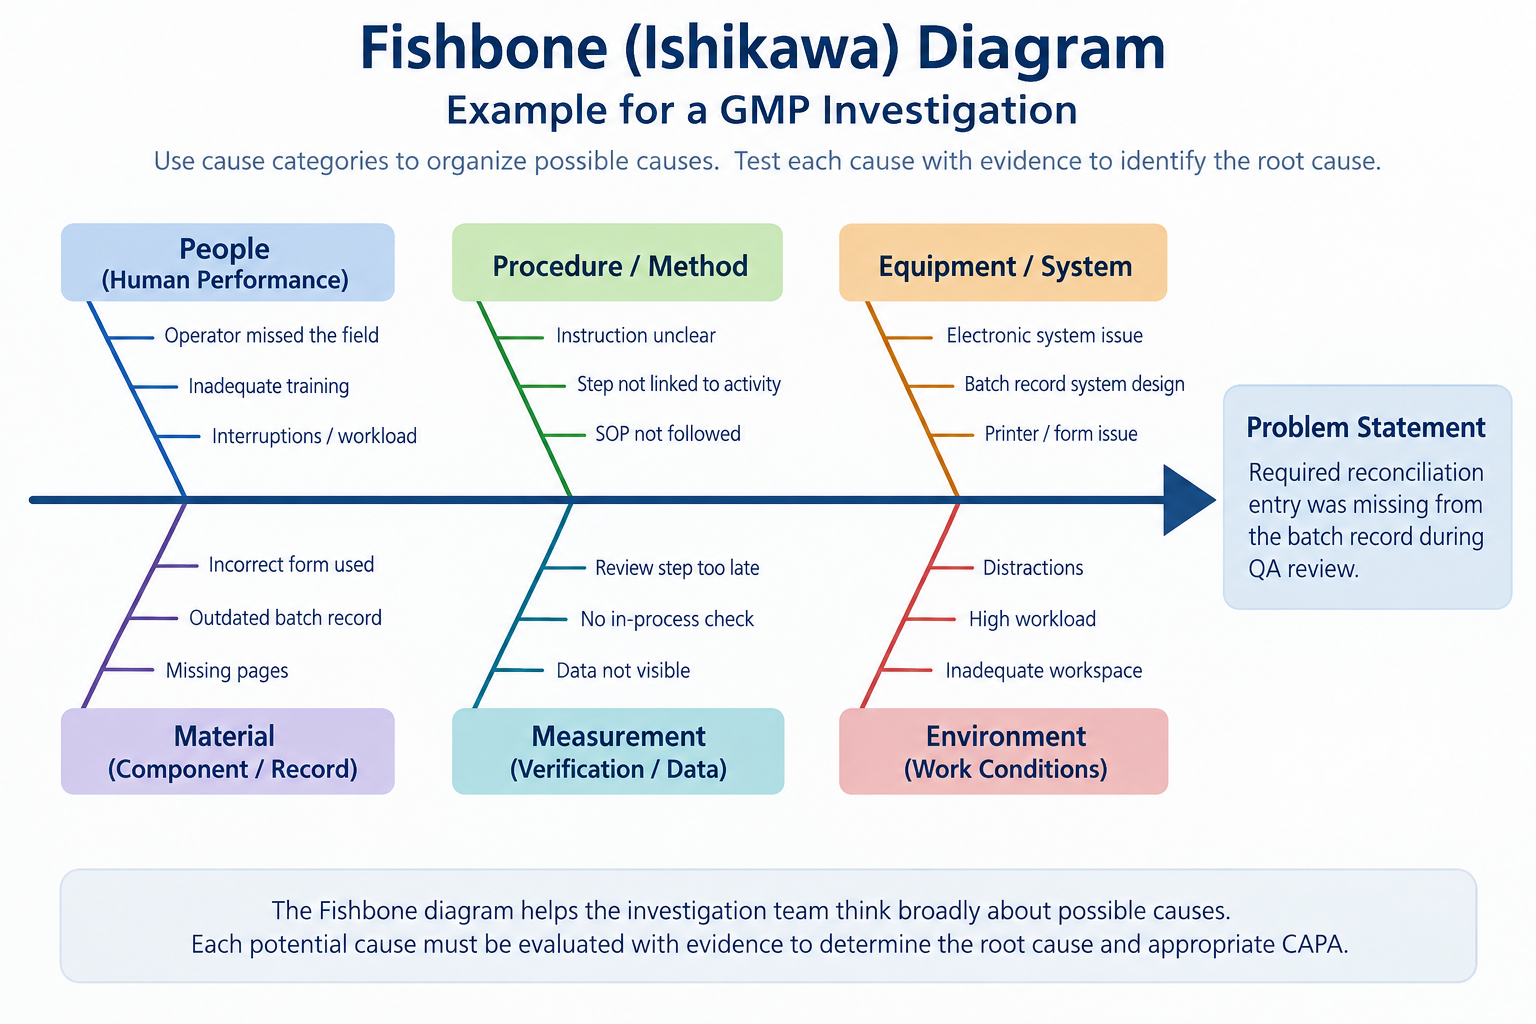
Example Fishbone diagram showing how GMP investigation teams can organize possible causes before evaluating evidence and selecting a supported root cause.
Do You Need to Use All 6Ms?
No. A Fishbone diagram does not require a full investigation of every 6M category.
The 6Ms help the team think broadly. They reduce the risk of tunnel vision. But they should not become a checklist where every category receives the same level of investigation whether or not it is relevant.
A practical approach is:
Briefly screen the major categories.
Ask whether each category could reasonably have contributed.
Focus evidence collection on the categories with a plausible connection to the event.
Document why irrelevant categories are not pursued.
Avoid forcing generic causes into every branch.
For example, in a batch record documentation error, People, Procedure/Method, Workflow, Record Design, and Controls may be highly relevant. Material may not need deep review unless the documentation error involved material identity, reconciliation, labeling, or component use.
In an environmental monitoring excursion, Environment/Facility, Cleaning, Personnel Flow, Material Movement, Monitoring Method, and Recent Interventions may be more relevant than batch record design.
The Fishbone should be broad enough to prevent tunnel vision, but focused enough to support evidence-based investigation.
When Fishbone Works Well
A Fishbone diagram works well when the event may involve several possible contributing factors.
It is useful when:
the first explanation is not strong enough
the event may involve people, procedure, equipment, material, environment, records, or controls
the team needs cross-functional input
a 5-Why analysis begins to branch into several paths
the event is repeat, complex, or not fully understood
the investigation needs to avoid jumping too quickly to human error
This connects closely to 5-Why Analysis in GMP Investigations. A 5-Why follows one causal chain. A Fishbone helps when the team needs to organize several possible cause categories before selecting the supported path.
Common GMP uses include:
recurring documentation errors
repeated line clearance failures
OOS or OOT results with possible lab and process factors
environmental monitoring excursions
equipment-related deviations
wrong material, label, component, or record selection
repeated deviations where prior CAPA did not prevent recurrence
When Fishbone May Not Be Needed
A Fishbone is not required for every deviation.
It may be unnecessary when the event is narrow, the causal path is clear, evidence supports a simple conclusion, and the risk is low. In those cases, a focused 5-Why or documented rationale may be enough.
Using a Fishbone does not make an investigation stronger if the diagram only lists generic possibilities that are never tested.
A weak Fishbone may look complete but still fail to support the conclusion. This is one of the broader RCA failure patterns discussed in When Root Cause Analysis Goes Wrong.
How to Build a Fishbone Diagram
A practical Fishbone process looks like this:
Define the problem statement clearly.
Choose relevant cause categories.
List possible causes under each category.
Convert vague causes into specific, testable questions.
Identify what evidence is needed to confirm or rule out each cause.
Review the evidence.
Narrow to supported root cause and contributing causes.
Connect the conclusion to CAPA or no-CAPA rationale.
The problem statement should be factual.
Weak problem statement:
Operator failed to follow procedure.
Stronger problem statement:
Required reconciliation entry was missing from the batch record at QA review.
The weak version already assumes the cause. The stronger version describes the event and leaves room for investigation.
Practical Example: Missing Batch Record Entry
Event:
Required reconciliation entry was missing from the batch record during QA review.
A Fishbone analysis may look like this:
| Category | Possible Cause | Evidence to Check | Result / Conclusion |
|---|---|---|---|
| People / Human Performance | Operator missed the field | Interview, training record, qualification status, prior performance | Operator completed other related fields; training was current |
| Procedure / Method | Instruction unclear or not linked to the activity | SOP review, batch record instruction review | Instruction existed but was separated from the execution step |
| Record Design | Field placement did not match workflow | Batch record layout, form revision history | Field appeared after several unrelated entries |
| Workflow | Entry completed after activity instead of during activity | Process observation, operator interview | Documentation was commonly completed after the activity |
| Controls / Verification | Review step occurred too late to detect omission during processing | Review procedure, QA review timing | QA review occurred after batch completion |
| Management System | Form revised without usability review | Change control, document revision history | Revision added field but did not assess execution flow |
The Fishbone does not automatically select the root cause. It helps organize possible causes and evidence.
In this example, the stronger conclusion may be:
The batch record design and review timing did not support reliable completion and early detection of the reconciliation entry.
This conclusion is stronger than “operator error” because it identifies a controllable condition. It also supports more meaningful action, such as revising the batch record layout, adding an in-process verification point if justified, and reviewing similar record sections.
Mini Example: Environmental Monitoring Excursion
Event:
Grade C room exceeded the viable count action level.
Relevant Fishbone categories may include:
Environment/Facility: HVAC, pressure cascade, temperature, humidity
Cleaning/Disinfection: cleaning agent, frequency, contact time, technique
People/Human Performance: gowning, aseptic behavior, room activity
Material Movement: transfer route, disinfection of materials, staging
Monitoring Method: sampling location, timing, technique, plate handling
Recent Interventions: maintenance, room access, equipment movement
Historical trend: prior excursions, organism recovery, seasonal pattern
For this event, a Fishbone diagram helps the team avoid focusing only on the operator or only on the facility. It creates a structured review of plausible sources and controls.
The final conclusion should still be based on evidence, such as organism identification, cleaning records, HVAC data, personnel flow, intervention history, and monitoring trends.
Common Fishbone Mistakes
A Fishbone diagram can be misused.
Common mistakes include:
filling every branch with generic causes
treating all brainstormed causes as equally likely
using the diagram after the root cause is already chosen
failing to define evidence needed for each possible cause
listing “human error” without exploring task or system conditions
not distinguishing root cause from contributing cause
failing to document why causes were ruled out
creating a large diagram but a weak conclusion
A Fishbone should help the team test possibilities. It should not become an attachment to a conclusion already selected.
This is also where Cognitive Bias in GMP Investigations matters. If the team already expects the cause to be human error, equipment failure, or training gap, the Fishbone may be filled in a way that supports that expectation. QA review should challenge that.
QA Stress Test for the Fishbone
A Fishbone diagram should be able to stand up to basic QA review.
| QA Review Question | What the Fishbone Should Show |
|---|---|
| Is the problem statement factual? | The event is described without assuming the cause. |
| Are the categories relevant? | The branches match the event, process, risk, and investigation type. |
| Are listed causes specific and testable? | Each possible cause can be checked against records, observations, interviews, data, or trends. |
| Does the diagram avoid tunnel vision? | The analysis considers more than one plausible pathway where appropriate. |
| Were irrelevant categories screened or ruled out? | Low-relevance branches are briefly justified rather than forced. |
| Is the selected cause supported by evidence? | The final conclusion is tied to documented findings, not only brainstorming. |
| Are contributing causes handled appropriately? | Relevant contributing causes are addressed, controlled, or justified. |
| Does CAPA match the supported cause? | The action addresses the condition supported by the Fishbone evidence. |
If the Fishbone cannot answer these questions, it may need more evidence or a clearer explanation of how the team narrowed the cause.
When to Combine Fishbone with Other RCA Tools
Fishbone and 5-Why can work well together.
A Fishbone may identify several possible cause categories. Then 5-Why can be used to go deeper into one supported branch.
For example:
Fishbone identifies batch record design as a likely factor.
5-Why explores why the design allowed the entry to be missed.
A Fishbone can also lead into Fault Tree Analysis when the investigation needs to test logical combinations of failures.
For example:
wrong material was available
material selection control failed
independent verification did not detect the issue
If the event required more than one condition to occur together, a Fault Tree may help test the logic more clearly.
QA Review Perspective
A Fishbone diagram is useful when it helps the investigation think broadly and narrow carefully.
It is not useful when it becomes a list of guesses or a formality. The diagram should help the team identify plausible causes, define evidence needs, rule out unsupported pathways, and explain why the selected cause is supported.
The value of a Fishbone diagram is in helping the investigation reach a defensible, evidence-based conclusion.
A strong Fishbone keeps the investigation from jumping too quickly to the familiar answer. It supports better root cause logic, better CAPA decisions, and stronger investigation closure.
Explore more on Investigations & CAPA Excellence
Browse VerethiQ resources on deviation handling, root cause analysis, investigation quality, CAPA design, effectiveness checks, recurrence prevention, and investigation governance.